Common Ir Spectra Peaks

Infrared (IR) spectroscopy is a powerful analytical technique used to identify and characterize chemical compounds based on their vibrational modes. The IR spectrum of a molecule provides a unique “fingerprint” that can reveal information about its functional groups and structural features. Understanding common IR spectra peaks is essential for interpreting spectral data and identifying unknown compounds. Below is a comprehensive guide to the most frequently observed IR absorption peaks, their corresponding vibrational modes, and the functional groups they represent.
1. Introduction to IR Spectroscopy
Infrared spectroscopy measures the absorption of infrared light by a sample, causing molecular vibrations. These vibrations occur at specific frequencies, which are detected as peaks in the IR spectrum. The typical IR region ranges from 4000–400 cm⁻¹, with higher wavenumbers (lower wavelengths) corresponding to higher energy transitions.
2. Key IR Spectra Peaks and Their Assignments
Below is a detailed breakdown of common IR peaks, organized by wavenumber range and associated functional groups.
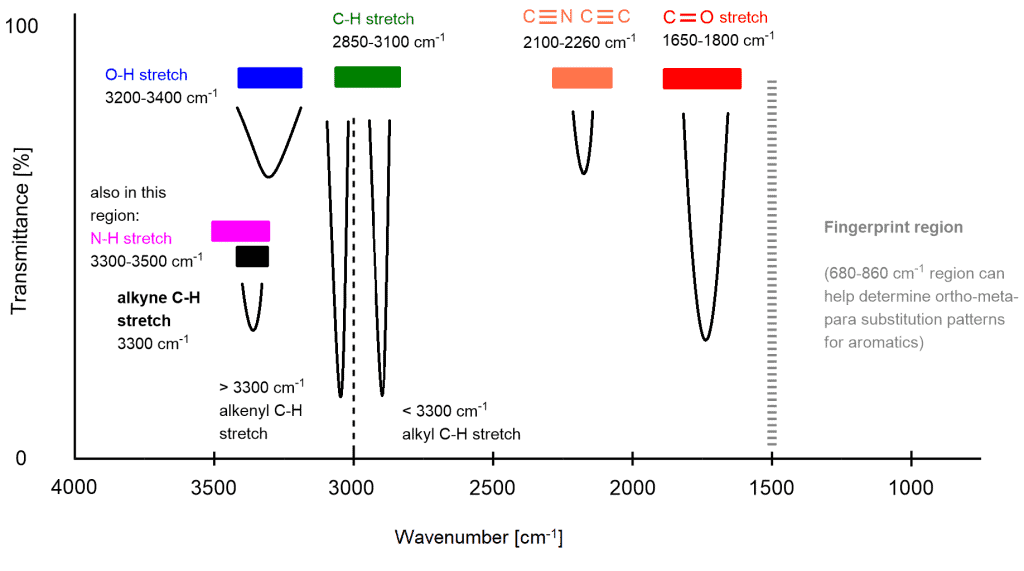
a. 3600–3200 cm⁻¹: O-H and N-H Stretches
- 3600–3200 cm⁻¹: Broad, strong peak for O-H (alcohol) or N-H (amine) stretches.
- Alcohol O-H: Broad due to hydrogen bonding (e.g., 3500–3200 cm⁻¹).
- Amine N-H: Sharp to moderately broad (e.g., 3400–3300 cm⁻¹).
b. 3300–2500 cm⁻¹: C-H Stretches
- 3300–3000 cm⁻¹: C-H stretches in alkenes (e.g., =CH₂ at 3100–3000 cm⁻¹).
- 3000–2850 cm⁻¹: C-H stretches in alkanes.
- CH₃ (methyl): 2960–2870 cm⁻¹ (asymmetric), 2870–2840 cm⁻¹ (symmetric).
- CH₂ (methylene): 2960–2850 cm⁻¹ (asymmetric), 2870–2840 cm⁻¹ (symmetric).
c. 2260–2100 cm⁻¹: Triple Bond Stretches
- 2260–2100 cm⁻¹: C≡C (alkyne) and C≡N (nitrile) stretches.
- C≡C: 2150–2100 cm⁻¹.
- C≡N: 2260–2210 cm⁻¹.
d. 1900–1650 cm⁻¹: C=O and C=C Stretches
- 1750–1700 cm⁻¹: C=O stretch in ketones and aldehydes.
- 1740–1700 cm⁻¹: C=O stretch in esters and carboxylic acids.
- 1680–1630 cm⁻¹: C=O stretch in amides.
- 1650–1600 cm⁻¹: C=C stretch in alkenes.
e. 1600–1500 cm⁻¹: N-H and C-N Stretches
- 1600–1500 cm⁻¹: N-H bending in amines and C-N stretches in aromatic rings.
f. 1500–1000 cm⁻¹: Fingerprint Region
- 1470–1400 cm⁻¹: CH₂ and CH₃ bending in alkanes.
- 1300–1000 cm⁻¹: C-O stretches in ethers, alcohols, and esters.
g. 1000–650 cm⁻¹: Aromatic and Halogen Stretches
- 1000–650 cm⁻¹: C-H bending in aromatic rings and C-X stretches in halogenated compounds.
3. Comparative Analysis of Functional Groups
To illustrate the differences between functional groups, consider the following table:
| Functional Group | Peak Range (cm⁻¹) | Notes |
|---|---|---|
| Alcohol (O-H) | 3600–3200 | Broad peak due to hydrogen bonding |
| Alkene (C=C) | 1650–1600 | Sharp peak for isolated double bonds |
| Ketone (C=O) | 1715–1700 | Strong, sharp peak |
| Amide (C=O) | 1680–1630 | Overlaps with N-H bending |

4. Practical Applications of IR Spectroscopy
IR spectroscopy is widely used in: - Organic Chemistry: Identifying functional groups in synthesized compounds. - Pharmaceuticals: Analyzing drug formulations and impurities. - Forensics: Identifying unknown substances in crime scenes. - Environmental Science: Detecting pollutants in air and water samples.
5. Expert Insights: Common Pitfalls in IR Interpretation
When interpreting IR spectra, avoid these common mistakes:
- Overlooking Broad Peaks: Broad peaks (e.g., O-H or N-H) are often indicative of hydrogen bonding.
- Misidentifying Overlapping Peaks: Multiple functional groups can absorb in the same region (e.g., C=O and C=C).
- Ignoring the Fingerprint Region**: This region provides unique patterns for identifying specific compounds.
6. Future Trends in IR Spectroscopy
Advancements in IR spectroscopy include: - FTIR (Fourier Transform IR): Improved sensitivity and speed. - ATR-IR (Attenuated Total Reflectance): Non-destructive analysis of solid samples. - Hyperspectral Imaging: Combining IR spectroscopy with imaging for spatial analysis.
7. FAQ Section
What causes the broad peak in alcohols around 3300 cm⁻¹?
+The broad peak is due to hydrogen bonding between O-H groups in alcohols, which weakens the O-H bond and broadens the absorption.
How do you distinguish between a ketone and an aldehyde in IR spectra?
+Both show C=O stretches around 1715–1700 cm⁻¹. Aldehydes often exhibit a C-H stretch around 2820 cm⁻¹ (from the aldehyde proton), which is absent in ketones.
Why is the fingerprint region important in IR spectroscopy?
+The fingerprint region (1500–1000 cm⁻¹) provides a unique pattern of peaks that can be used to identify specific compounds, similar to a molecular fingerprint.
8. Conclusion
Understanding common IR spectra peaks is crucial for accurately interpreting spectral data and identifying functional groups in organic compounds. By familiarizing yourself with the characteristic absorptions of key functional groups, you can effectively analyze IR spectra and apply this knowledge in various scientific fields. As technology advances, IR spectroscopy continues to evolve, offering even greater precision and applications in research and industry.

